
School air quality assessments
Assessment approach
Our School Air Quality Assessments (previously called Audits) follow a structured approach which consists of three key stages:
- Stage 1: Pre-planning and scheduling
- Stage 2: Fieldwork and engagement
- Stage 3: Recommendations and reporting
Pre-planning and scheduling
We contact the school and a schedule for the tasks to be undertaken is agreed, which fits in with the operations of the school and the availability of key staff contributing to the assessment.
Prior to the assessment, a desktop review of the local area around the school site and the wider catchment is undertaken, to highlight key features for the assessors to then assess further whilst on site. This includes an evaluation of local air quality monitoring, potential sources of pollution, likely causes of exposure and notable features such as infrastructure and developments in the local area.
The latter part of the assessment focusses on features which may have a bearing on potential mitigation measures such as the location of major roads, bus routes, pedestrian crossings, physical barriers such as railways or rivers, and nearby construction sites and planned developments.
Fieldwork and engagement
The approach taken in carrying out the assessment comprises several elements, including a visit to the school by Air quality officers. A key element of the assessment is to capture the views and concerns of the school community via the participating staff, and to get an understanding of school operational considerations and school travel behaviour trends. As such, a three-step approach is taken and is summarised as:
- Internal school air quality assessment including pollution monitoring and assessment of sources
- External site walk and travel mode observation during morning peak arrival times
- Assessment meeting with key school staff to exchange information, and to discuss potential issues and solutions
An assessment of the building is undertaken with the assistance of the premises/facilities manager, which includes classroom air quality monitoring, a review of the school's heating and ventilation systems (including the boiler room), and any other potential sources of pollution such as the kitchen. Initial observations and site familiarisation are undertaken by the assessors prior to the school day start. This scheduling allowed officers to sense check the information and maps compiled from the desktop assessment carried out during the initial stage.
Observations of how pupils arrive at the school are undertaken by Air quality officers during the morning drop-off period. During the internal and external site walks, the assessors capture as much information as possible about activity in and around the school, and use comprehensive photo records and discussions with school staff to capture relevant issues, including those which were not evident during the assessment.
The external observations include assessing ventilation methods and identifying possible sources of pollution, especially in the proximity of classrooms and playgrounds as these are where children spend the most time.
An assessment meeting is then undertaken with the school’s choice of staff and borough Air quality officers. This session serves several functions, including:
- Providing the school with an indication of the pollution monitoring results and giving them the opportunity to voice any concerns and to ask questions
- Providing the assessors with additional information about the school and issues not observed directly, such as school travel planning, on-going and planned developments at the school and locally, and any related concerns that the school have
Recommendation and reporting
The assessors review the findings of the assessment and preparatory assessments in order to develop the advice and recommendations provided in the assessment report, based on best practice measures.
Understanding air quality
Air pollution can adversely affect human health and has been linked to many health conditions including cancer, asthma, stroke and heart disease, as well as diabetes, obesity, and poor concentration levels. Children are more vulnerable to the effects of air pollution because their lungs are still developing and they have higher breathing rates than adults.
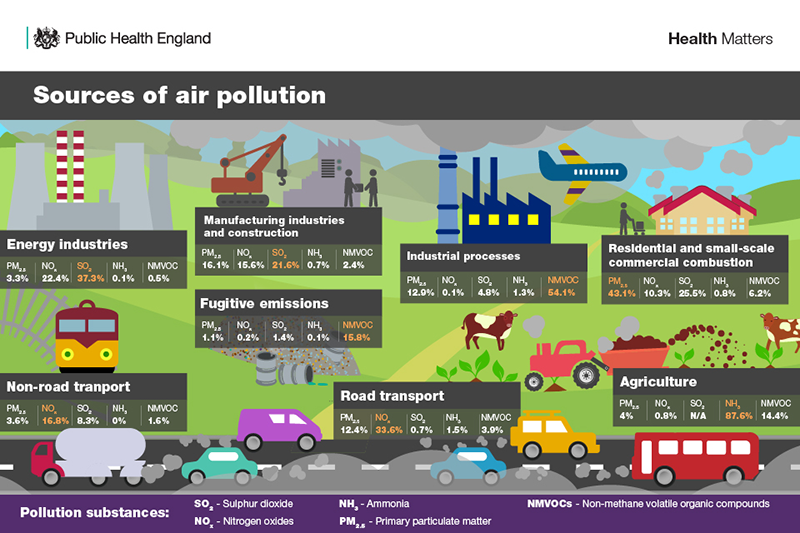
There are many sources of air pollution, but in London, road transport is a major contributor to outdoor emissions.
Outdoor air pollution
A study carried out by the Environmental Research Group now based at Imperial College London, found that long term exposure to air pollution can shorten Londoner’s lives and results in to up to 9,400 premature deaths every year in the capital1. The research also showed that there are additional impacts due to short term pollution episodes. Air quality tends to be worst close to major roads, but emissions from a range of sources and over wide areas can contribute to background pollution levels, as Figure 1 illustrates.
Air pollution is a worldwide issue that affects everyone, but often the most socio-economically disadvantaged suffer most from the health effects of pollution. Other groups disproportionately affected include older people, children, pregnant women, individuals with existing medical conditions, and communities in areas of higher pollution levels.
There is strong evidence that health effects can potentially occur below widely accepted international standards and goals. For some pollutants, such as particulate matter (PM), there is no known threshold below which health effects do not occur. For that reason, the World Health Organisation (WHO) issued new guidelines in the autumn of 20212 which recommend that the targets for many common pollutants should be more stringent in order to protect human health.
This report refers to several types of pollutants. The definitions used here are taken from the Department for Environment, Food and Rural Affairs (Defra) UK Air website.
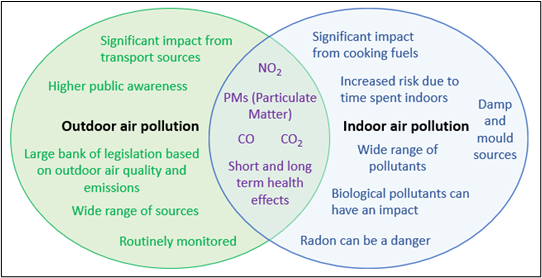
Indoor versus outdoor air quality
We know that outdoor air pollution is harmful to human health, but historically, awareness of indoor air pollution was relatively low and less importance has been given to its sources and potential health effects. On average, people spend up to 90% of their time indoors, so it is important to understand what indoor pollution is and where it comes from.
Indoor air pollution is essentially dust, dirt or gases in the air inside a building (such as your school, workplace or home), which can be harmful to health. Air pollutants produced inside buildings are principally produced from: cooking and heating; cleaning, painting and varnishing materials; the build-up of mould from water droplets; and chemicals in new furniture, carpets and furnishings.
Indoor pollution can also be due to outdoor pollutants that get inside, the most common ones being emissions from traffic and industry, and natural radon gas. However, in our borough radon levels are very low so there is less than 1% chance of having a radon concentration at or above the action level set by Public Health England). Figure 2 illustrates the similarities and differences between outdoor and indoor air pollution.
What is Particulate Matter?
Particulate Matter (PM) is a generic term used to describe a complex mixture of solid and liquid particles of varying size, shape, and composition. Some particles are emitted directly (referred to as primary PM); others are formed in the atmosphere through complex chemical reactions (known as secondary PM). The composition of PM varies greatly and depends on many factors, such as geographical location, emission sources and weather.
The main sources of manufactured PM are the combustion of fuels (by vehicles, industry and domestic properties) and other physical processes such as vehicle tyre and brake wear. Natural sources include windblown soil and dust, sea spray particles and burning vegetation. PM is often classified by particle size and referred to as:
- Coarse particles (PM10); particles that are less than 10 microns (µm) in diameter
- Fine particles (PM2.5); particles that are less than 2.5 µm in diameter
- Ultrafine particles (PM0.1); particles that are less than 0.1 µm in diameter
The potential adverse health effects are mainly determined by the size of particles and the duration of exposure (how long someone breathes them in). Particles larger than 10 µm are mainly deposited in the nose or throat, while particles smaller than 10 µm pose the greatest risk because they can be drawn deeper into the lungs. The strongest evidence for effects on health is associated with fine particles (PM2.5).
What is Nitrogen Dioxide?
Nitrogen dioxide (NO2) is a gas that is produced along with nitric oxide (NO) when fuels are burned, for example vehicle fuels such as diesel and petrol, or natural gas in a heating system. Together they are often referred to as oxides of nitrogen (NOx). Defra estimates that in areas where the UK is exceeding NO2 limits, 80% of NOx emissions are due to transport.
The largest source is emissions from light duty diesel vehicles (cars and vans), with vehicle emissions contribute significantly to local increases in concentrations especially near busy roads. Other sources include power generation, industrial processes, and domestic heating (e.g. boiler emissions). NO2 is a pollutant that can cause respiratory inflammation and can exacerbate respiratory problems such as asthma and bronchitis when concentrated at high levels.
National Air Quality Objectives
The UK government sets National Air Quality Objectives (Table 1) which indicate the target levels for common pollutant concentrations recorded over set time periods. These objectives are used for the protection of human health and are specific to outdoor pollution levels.
| Pollutant | Period | Concentration (limit value µg/m3) |
|---|---|---|
| PM2.5 | 24 hours | - |
| PM2.5 | Annual mean | 20 |
| PM10 | 24 hours | 50 (not to be exceeded more than 35 days per year) |
| PM10 | Annual mean | 40 |
| NO2 | Hourly | 200 (not to be exceeded more than 18 times per year) |
| NO2 | Annual mean | 40 |
Indoor Air Quality guidelines
There are currently no national objectives (or other regulations) dedicated to indoor air pollutants. However, the UK government’s Air Quality Expert Group’s recent publication on indoor air quality3, states that the 2010 World Health Organisation (WHO) Air Quality guidelines for particulate matter are applicable for indoor spaces.
We therefore refer to these levels for indoor particulates (PM2.5 and PM10), and they are provided in Table 2. It should be noted that, unlike the UK National outdoor air quality Objectives, these indoor limit values were issued for guidance and have no statutory requirements.
| Pollutant | Period | Concentration (limit value µg/m3) |
|---|---|---|
| PM2.5 | 24 hours (99th percentile i.e. 3-4 exceedence days per year) | 15 |
| PM2.5 | Annual mean | 10 |
| PM10 | 24 hours (99th percentile i.e. 3-4 exceedence days per year) | 45 |
| PM10 | Annual mean | 20 |
Monitoring overview
The rationale for the air quality monitoring is as follows:
- To measure the air pollution, specifically the particulate matter, inside the school and in the playground
- To better understand the air pollution and its likely source(s), in and around the school
- To evaluate the monitoring results in order to develop recommended actions for the school to take to help reduce localised air pollution exposure.
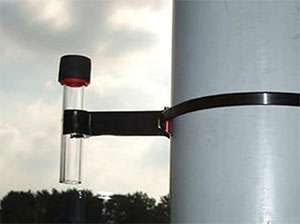
Nitrogen Dioxide (NO2) monitoring method
Local authorities in the UK widely use Palmes-type passive diffusion tubes (Figure 3) to provide an assessment of nitrogen dioxide (NO2) concentrations. We diffusion tubes to record NO2 levels across the borough as part of the Richmond Air Quality Monitoring Network. The majority of locations are sited on main roads and in commercial centres where air pollution levels may be elevated.
The diffusion tubes monitor NO2 continually and are usually replaced every four-weeks to provide a monthly average record. The measurements can therefore be used to give an indication of how this type of pollution varies seasonally, typically increasing in the winter months, but can also be affected by single events. The data gathered should represent typical seasonal pollution levels, excepting any extended pollution episode(s).
Every year, our monitoring results are bias-adjusted and used to produce an annual average reading of ambient NO2 concentration. At the time of each assessment, the most current annual bias-adjusted NO2 data available are given in the most recent Annual Status Report. View a map of the annual results from sites across the borough.
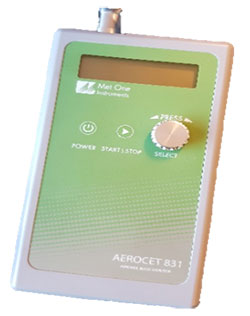
Particulate Matter (PM2.5 and PM10) monitoring method
Particulate Matter PM2.5 is a major pollutant of concern in the UK, and in addition to this, PM10 is also present. Studies have linked both PMs to bronchitis, sinusitis, frequent colds, exacerbated asthma symptoms and reduced lung function.
Particulate Matter monitoring takes place at the school during an assessment. The equipment used is an Aerocet 831 handheld mass monitor from Met One instruments, as shown in Figure 4. The monitor takes an on-the-spot air sample over a 60 second period and analyses it, providing measurements in µg/m3 for both PM2.5 and PM10.
Outdoors, particulate matter can be influenced by weather, with rain removing and washing away particulates in the air and wind dispersing it. Therefore, the weather is noted when assessment readings are taken and also those of the preceding day. The measurements of Particulate Matter are included in the results section of the assessment report. It is important to be aware that the results provide a snapshot of a particular moment in time and cannot be taken to be representative of annual data.
Particulates in the air are affected by a wide range of factors including traffic, weather and can contain dust blown from overseas; thus, particulate matter levels will inevitably vary. The above equipment only measures particle size; neither the composition nor the source of the particles could be determined, which would require a more complex laboratory assessment.
Real-time combined monitoring method
In late 2021 we invested in a number of real-time sensors as part of the Breathe London network, which monitor PM2.5 and nitrogen dioxide (NO2). Many things including peak travel times, pollution events and weather can all affect pollution levels. Real-time monitoring of pollutant concentrations will likely show ‘spikes’ (high levels) in pollution levels which correspond to a particular time of day (such as drop-off and pick-up times) and may help the school to choose whether to limit window and door ventilation to periods of lower pollution.
For each assessment, data from the nearest sensor(s) are reviewed. Unless a sensor is sited outside of a school due to differences in road types and traffic levels, the air quality conditions at many of these sites, especially for nitrogen dioxide, are often not comparable to those at a school. Looking at data from a number of monitoring stations can indicate varying pollution levels in the wider area and if one or more monitoring sites coincide with travel routes, this may give an indication of possible poor air quality exposure during the school commute. The Breathe London sensor data are available in real time for all of the sites in the borough on the Breathe London website. Data can be viewed and downloaded for any date range between their inception and the present or (where applicable) their decommission.
In addition to the monitoring methods already covered, we are running a three-year project to monitor PM2.5, PM10 and nitrogen dioxide outside all state schools for a year, and where applicable, these data are used to inform an assessment. More information can be found on our School Air quality monitoring page, which also gives the results available to date, starting with the initial 2022 group of 25 schools.
Modelled air quality in the surrounding area
Modelled baseline annual mean concentrations of PM2.5, PM10 and NO2 are taken from the most recent London Atmospheric Emissions Inventory (LAEI) model and plotted to show indicative pollution within the vicinity of the school. The contours (changes in colours) show how the pollution gradient changes across the area, which is especially useful where there are no actual monitoring locations. The LAEI uses an atmospheric dispersion model for air pollution, accounting for emission estimates from a wide range of sources including transport, commercial and industrial.
In general, higher modelled concentrations of NO2 are seen along main roads and in town centres where vehicles queue and high buildings trap air pollution in place. The modelled NO2 can exceed the objective level on major A roads, being generally between 40 and 60 µg/m3 along parts of the A205 (South Circular) and the A316 where traffic queues regularly, especially around sets of traffic lights. The levels of modelled PMs are generally at ‘background level’ (typically 14 µg/m3) in the borough except during pollution episodes which have a range of causes, usually caused by sources of particles outside of the borough and often beyond London.
School travel plan and sustainable behaviour
Good school travel and positive sustainable behaviours noted in our schools during assessments include one or more of the following:
- Participating in the TfL STARS scheme, (renamed TfL Explorers for primary level and TfL Pioneers for secondary schools). The majority of our Primary Schools are registered, with many attaining a bronze, silver or gold accreditation level which reflects a commitment to encourage sustainable travel habits within the school community, especially an increase in active travel (walking, cycling, scooting) coupled with a reduction in the number of journeys made by car every day.
- Having a current school travel plan and where possible a dedicated school travel planner who is assigned time to fulfil this role.
- Supporting cycling, scooting and walking (active travel) in different ways, More information about how this can be done is provided in the recommendations section.
- Raising awareness of idling through campaigns and education, because increasing understanding may prompt positive behavioural change. And displaying an ‘Anti-idling’ banner on a perimeter fence where passing drivers can see it.
- Getting involved with the Junior Travel Ambassador Scheme which provides training to help consolidate knowledge and behaviours around road safety and active travel.
- Using your website and school newsletter to help reduce car use by your school community and visitors. Ideas for ways to do this are included in the Traffic related air pollution recommendations below.
- Working with us to introduce a School Street (where this is possible) which improves the road safety and local air pollution for the school community and residents in the vicinity of the school.
- Having an eco-team or committee that is run by children for children to empower them to instigate measures that encourage sustainable behaviours amongst their peers and the wider school community.
- Having designated student Health, Safety and Environment (HSE) officers or committee that raise awareness of issues in and around the school, including road safety. Support available includes our Safe Walking pedestrian training scheme for year 3 pupils.
Interventions to help improve air quality
We have identified a range of measures and initiatives to deliver air quality improvements and to help reduce exposure to air pollution by the school community and relevant measures are recommended in a school’s Air Quality Assessment Report. Each intervention will contribute directly or indirectly to help improve the air quality in and around a school. The recommendations include both physical measures and softer behavioural measures.
Recommended interventions will be specific to each school because the characteristics of the local area, the school site and building, as well as existing processes and behaviours are considered to produce a tailor-made package of suitable measures. The measures we recommend which help to improve the local air quality have additional co-benefits such as boosting physical activity or raising awareness about road safety,
Active travel
Schools can encourage cycling, walking and scooting (active travel) for the school commute for staff and pupils, as well as for other local journeys. Active travel boosts physical and mental health, and avoiding the use of vehicles can help improve local air quality.
Schools can maintain or encourage high levels of active travel with the help of various free Council-run training schemes for cycling, walking and scootering, by providing covered cycle and scooter parking, as well as by participating in National campaigns and hosting regular active travel activities.
Traffic-related air pollution exposure
Around half of London’s outdoor air pollution is created by road traffic and it is known to have negative health impacts on children because they are still growing and have high breathing rates. This includes causing and worsening asthma and other respiratory conditions, stunting lung development and reducing their ability to concentrate and recall information (due to cognitive impairment).
Reducing vehicle use for the school commute and raising awareness of the positive health impacts of active travel would benefit the school community, as well as help to improve local air pollution. Schools can encourage shared travel when using a vehicle is necessary, display an ‘Anti-idling’ banner in a prominent place and run an idling action campaign, as well as setting up a ‘Park and stride’ scheme.
Low pollution routes
Since air pollution levels are usually relatively low at our school sites, many children may be exposed to higher levels of pollution when travelling to and from school than during the school day. Levels of some air pollutants such as nitrogen dioxide (NO2) reduce significantly with distance away from their source, so will be higher on busier main roads, and lower on quieter side roads.
Using quieter, lower pollution residential roads whenever possible is recommended, even if it makes the commute a little longer. Schools can help their community identify low pollution routes by advertising online route finders and creating a map of your school area highlighting quieter routes for walking, cycling and scooting to and from school.
Ventilation
Indoor air pollution concentrations are a function of both indoor and outdoor sources, where elevated outdoor concentrations produce elevated indoor concentrations (for example in urban areas with a higher density of traffic).
The World Health Organisation has stated that ‘A building’s proximity to roads has been shown to be one of the largest factors influencing indoor concentrations of air pollutants’. Schools with classrooms adjacent to a busy road should restrict the opening of road-facing windows to help reduce pupils’ exposure.
Raising awareness of air pollution
In addition to the suggestions for raising awareness of engine idling and active travel, other actions to consider are to take part in National campaigns which are often marked with Council-run activities, and to encourage your parent-teacher association to help inform the wider school community.
A pollution ‘barrier’
Children in playgrounds, especially those that are close to roads may be at some risk of exposure to pollutants from traffic related emissions. The school perimeter may act as a barrier to air pollution and provide safe-guarding protection if it is sufficiently high and made of solid material, whilst railings and open mesh fences have minimal use for these purposes. Schools located in areas with higher air pollution may wish to consider installing a close-boarded wooden fence or wall if they don’t have either, or to erect a green barrier.
Deliveries to schools
Most schools have fairly frequent deliveries that range from regular catering supplies for the kitchen (which can be delivered more than once a day), to less urgent stationary and cleaning products which arrive more sporadically. Schools can help to reduce the number of delivery vehicles and related emissions, from our roads and more specifically at or around a school site in several ways, including by forward planning and amalgamation of orders, as well as banning deliveries at the start and end of the school day.
Cleaning at the school
There are several aspects related to cleaning which can be optimised in order to help reduce indoor air pollution at a school, including when cleaning takes place, ventilation levels and the products used as well as how they are applied.
Additional information
Schools that have had an air quality assessment
In addition to delivering some of the recommended measures to make quick improvements, schools may wish to think more holistically about how some of the medium to longer term recommendations can be progressed. It is also important to raise the school community’s awareness of air pollution and inform them of the assessment findings so that they can understand and support any future action.
The school and wider school community, including school governors, have an important leadership role to play in ensuring that measures to reduce exposure and contributions to air pollution are included in the school’s strategic plan.
Schools that would like to have an air quality assessment
We are committed to improving local air quality for the students and staff at our schools, as well as the wider community. When selecting schools to be assessed, we prioritise those in areas where air pollution is higher than average and/or have older buildings and support systems (such as boilers and ventilation systems). If you would like your school to be considered for an air quality assessment, email the Air Quality officer with your request.
All schools
Any school wishing to investigate the scope for delivering key measures, such as those recommended during their assessment, can request help from the Air Quality team. The Mayor of London funded Schools Pollution Helpdesk provides a list of potential funding sources and the school is encouraged to apply for these where appropriate to maximise the potential for delivering the recommendations and improving local air quality.
Footnotes
- Understanding the Helath Impacts of Air Pollution in London Walton et. al (2015)
- What are the WHO Air quality guidelines? World Health Organisation website (2021)
- Indoor Air Quality Report Defra Air Quality Expert Group (2022)
Up to: Schools air quality
Updated: 22 May 2026
